| |
Case
Study II: Control of a Chemical Reactor |
| |
| Author |
| |
Carla
Martín-Villalba |
| |
Departamento
de Informática y Automática, UNED |
| |
Juan del Rosal
16, 28040 Madrid, Spain |
|
|
|
| |
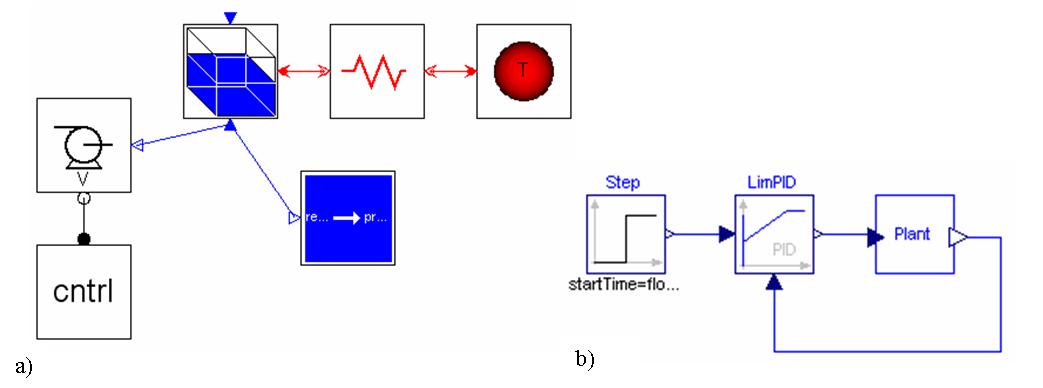
| The model of a batch
chemical reactor has been composed using JARA
Modelica library. The diagram of the reactor model is shown in Figure 1a
(it has been represented using Dymola). |
| |
| An exothermic reaction
A -> P is carried out in the liquid phase. The reactor contains a heat
exchanger, which can be operated with steam and with cooling water. The
diagram of the Modelica model describing the controlled system is shown
in Figure 1b. The PID controller model is included in the standard
Modelica library and it is designed according to the model provided
in (Astrom and Hagglund 95). It has limited output, anti-windup compensation
and setpoint weightings. It has the following parameters: proportional gain
(Kp), integral time constant (Ti), derivative time constant (Td), setpoint
weight for the proportional term (wp), setpoint weight for the derivative
term (wd), anti wind-up compensator constant (Ni), derivative filter parameter
(Nd), lower limit for the output (ymin) and upper limit for the output (ymax). |
| |
| |
Figure
1: Diagram of the reactor Modelica model: a) open-loop system;
and b) closed-loop system. |
| |
| The reactor's operation
policy is the following (Froment and Bischoff 79): |
| 1. |
Fill
up the reactor with the reacting liquid (the inflow is controlled
by a PID). |
| 2. |
Preheat to certain
temperature (T1), and let the reaction proceed adiabatically. |
| 3. |
Start cooling
when either the maximum allowable reaction temperature (Tmax) occurs
or the desired conversion is reached (xd), and cool down to the desired
temperature (Td). |
| 4. |
Empty the reactor. |
|
| |
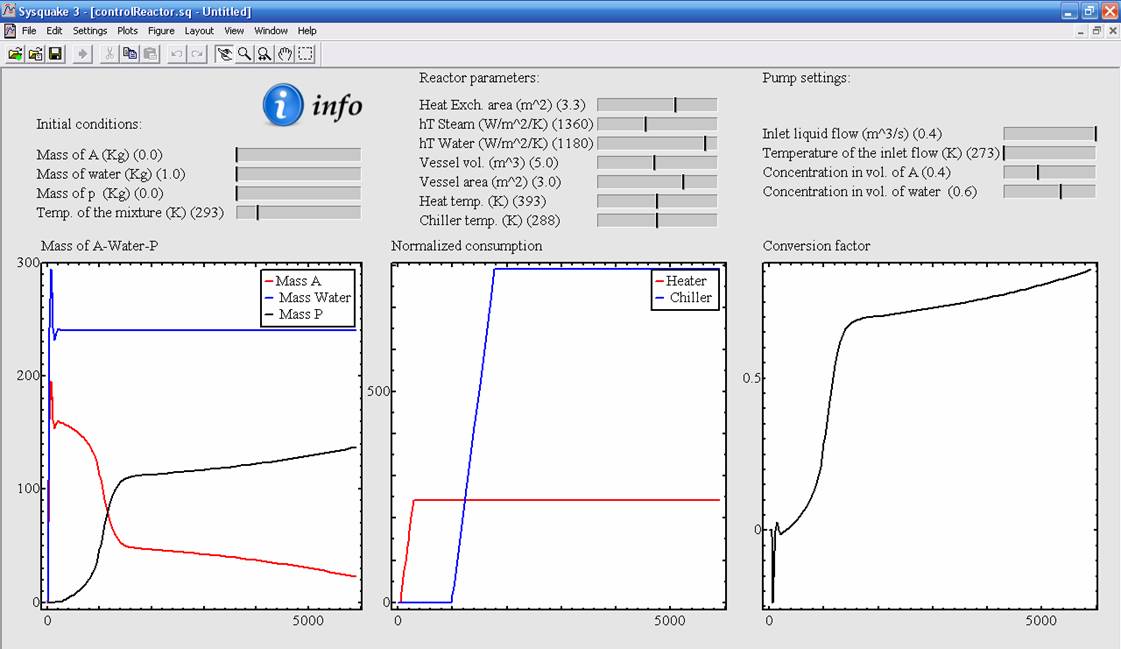
| The virtual-lab view
is shown in Figure 2. It contains sliders to change the model parameters,
the initial value of the state variables and the input variables. The "Settings"
menu allows the user to (see Figure 2): |
| 1. |
Change
the parameters of the control policy (i.e., T1, Tmax, xd, Td, and
the PID parameters). |
| 2. |
Set the communication
interval and the total simulation time. |
| 3. |
Launch a simulation
run. |
|
| In addition, the view
contains plots displaying the time evolution of some process variables,
including the mass of A, P and water, the mixture temperature and the pump
throughput. |
| |
|
Figure
2: View of the chemical reactor virtual-lab. |
| |
| References |
| Astrom, K. J. and
T. Hagglund (1995): "PID Controllers: Theory, Design and Tuning",
ISA Press. |
| Froment, G. F. and
K. B. Bischoff (1979): "Chemical Reactor Analysis and Design",
John Wiley & Sons, New York, USA. |
| |
|
| Carla Martin-Villalba |
| Last update: July
2007 |
| euclides
web server - Dept. Informatica y Automatica, UNED, Juan del Rosal 16,
28040 Madrid, Spain |